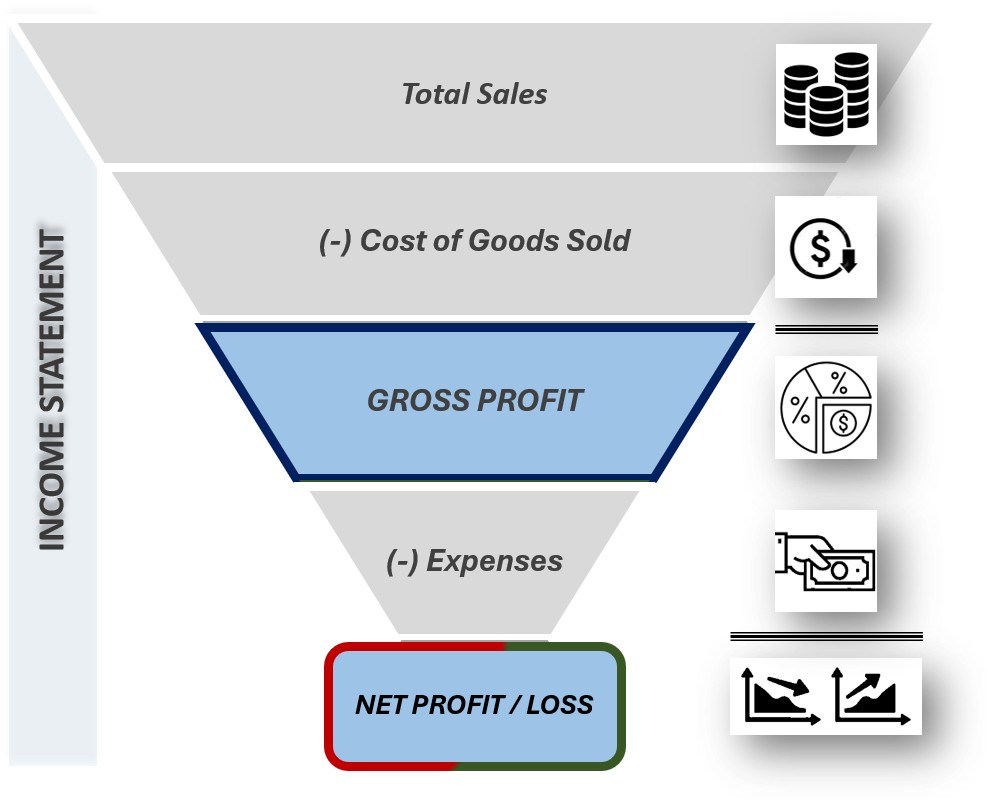
The income statement (or “P&L”) is a financial report produced on a periodic basis by an accountant, either external or in-house. In its basic form (Graphic 1), the P&L provides a summary of revenues, expenses, gains and losses over a specific period.
With reference to a restaurant, while sales figures are directly obtained from a POS, outflows are generally accounted for manually.
How is your POS set up?
Depending on the owner’s preference and the system’s capabilities, both sales and outflows should be broken down to some degree of detail (food sales, beverage sales, food cost, beverage cost and so on).
How informative is the P&L?
The P&L is the main information source to assess the business performance but in its generic format it is really not helpful: numbers must be recombined to derive actionable recommendations.
The raw P&L doesn’t really say much
STATIC PICTURE
It only provides a snapshot of the profit or loss for the period it covers (for example, a month) and very little else: it is a picture, not a video.
LIMITED INFORMATION CONTENT
It does not provide any prescriptive information: it just shows numbers with no context and no actionable levers.
NO BENCHMARKING
It is not designed as a comparison tool against industry standards or peers, nor does it incorporate qualitative factors.
POOR INPUT, IRRELEVANT OUTPUT
More often than not, unfortunately, restaurants’ POS systems are not set up with a sufficient level of granularity so that no details can be obtained looking at the P&L only.
Graphic 2
Imagine two friends – John and Mary – both having high fever: can you conclude that they are equally sick? Can they be treated with the same medicine? Shouldn’t they run tests and checks first?
Similarly (Graphic 2), two restaurants – Restaurant 1 and Restaurant 2 – are reporting the same high-level numbers for the month: Sales $100 / Net loss -$5.
Do these numbers show the same performance?
Both restaurants are losing money but the underlying cause is clearly not the same: what would you investigate? And how?
When should you be concerned?
> Is it a matter of operational efficiency or weak sales?
> Is this monthly loss a one-off or recurring?
> How many recurring losses identify a trend?
> Are competitors struggling too? How will you find out?
FROM A SET OF NUMBERS TO A POWERFUL INFORMATION TOOL
Graphic 3
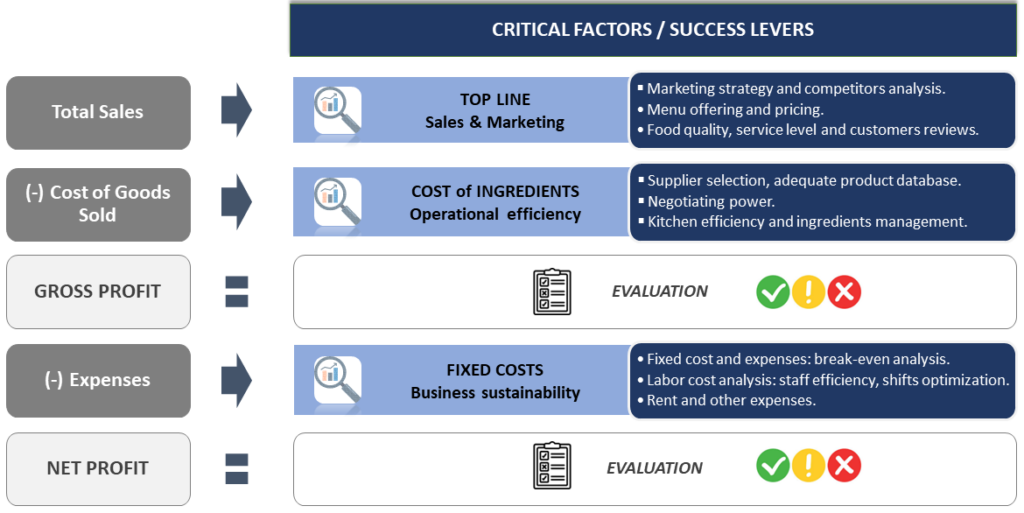
The right approach aims to identify how each P&L items is effectively linked to a specific part of the business and therefore affected by a number of critical factors (Graphic 3).
For example: the sales number depends mainly on the menu pricing, the marketing effort to attract more clients, the food quality etc.
Practical, quick to read and actionable
In order to derive specific action points, though, each of this factors must be operationally linked to a quantifiable metric that can be tracked. This leads up to the concept of Key Performance Indicator (or “KPI”).